Normalization and Quality Control
RPM (Reads per Million)
xpressplot.rpm ( data )
Purpose:
Perform reads per million sample normalization on RNAseq data
Formula:
\(RPM_{g} = \frac{1e6 \cdot r_{\textit{ge}}}{\sum_{g=1}^{n} r_{\textit{ge}}}\)
Assumptions:
- Dataframe contains raw count data, where samples are along columns and genes across rows
Parameters:
data: Input dataframe with counts values
Returns:
data_rpm: Pandas dataframe with RPM-normalized
Examples:
> data
      fGSM523242  fGSM523243  fGSM523244  fGSM523245  fGSM523246
Gene1 66          59          1           82          45
Gene2 35          0           7           72          2
Gene3 20          70          85          78          36
Gene4 96          7           93          38          85
Gene5 73          41          92          77          26
> data = xp.rpm(data)
> data
      fGSM523242  fGSM523243  fGSM523244  fGSM523245  fGSM523246
Gene1 227586.2069 333333.3333 3597.1223   236311.2392 231958.7629
Gene2 120689.6552 0.0000      25179.8561  207492.7954 10309.2784
Gene3 68965.5172  395480.2260 305755.3957 224783.8617 185567.0103
Gene4 331034.4828 39548.0226  334532.3741 109510.0865 438144.3299
Gene5 251724.1379 231638.4181 330935.2518 221902.0173 134020.6186
R/FPKM (Reads/Fragments per Kilobase Million per Million Mapped Reads)
xpressplot.r_fpkm ( data, gtf, feature_type=’exon’, identifier=’gene_name’, sep=’t’ )
Purpose:
Perform reads/fragments per kilobase per million mapped reads sample normalization on RNAseq data
Formulae:
\(RPKM_{g} = \frac{1e9 \cdot r_{\textit{ge}}}{(\sum_{g=1}^{n} r_{\textit{ge}}) \cdot \textit{l} _{\textit{ge}}}\)
\(FPKM_{g} = \frac{1e9 \cdot f_{\textit{ge}}}{(\sum_{g=1}^{n} f_{\textit{ge}}) \cdot \textit{l} _{\textit{ge}}}\)
Assumptions:
- Dataframe contains raw count data, where samples are along columns and genes across rows
- As FPKM was developed for paired-end sequencing, it accounts for two reads being able to map to one fragment. Therefore, input counts should have accounted for this is the counting step of sequence quantification. If specifying a paired-end alignment in XPRESSpipe, this will have been accounted for.
- By default, this will take the longest transcript based on combined exon length. If you prefer to use the cumulative exon length of the Ensembl canonical transcript, you must first curate the GTF using
xpresspipe modifyGTF -g transcripts.gtf -l- If you performed isoform quantification and wish to length normalize each isoform, provide
identifier='transcript_id'- If you would like to normalize based on CDS length, provide
feature_type='CDS'Parameters:
data: Input dataframe with counts values
gtf: GTF reference file path and name
feature_type: Label of feature to use in length normalization
identifier: Label for how to group genes/transcripts. If normalizing for a gene, use
gene_name or gene_id. If performing length normalization for isoforms, provide transcript_idsep: GTF delimiter (usually tab-delimited)
Returns:
data_rpkm: Pandas dataframe with R/FPKM-normalized
Examples:
> data
      fGSM523242  fGSM523243  fGSM523244  fGSM523245  fGSM523246
Gene1 66          59          1           82          45
Gene2 35          0           7           72          2
Gene3 20          70          85          78          36
Gene4 96          7           93          38          85
Gene5 73          41          92          77          26
> data = xp.r_fpkm(data, '/path/to/transcripts.gtf')
> data
      fGSM523242  fGSM523243  fGSM523244  fGSM523245  fGSM523246
Gene1 15006.3436  21978.9881  237.1833    15581.6457  15294.6567
Gene2 18516.3632  0.0000      3863.1261   31833.8133  1581.6628
Gene3 1552.2985   8901.5987   6882.0428   5059.5089   4176.8031
Gene4 10220.8992  1221.0702   10328.8988  3381.1932   13527.9835
Gene5 12188.2602  11215.7274  16023.5923  10744.2995  6489.1599
TPM (Transcripts per Million)
xpressplot.tpm ( data, gtf, feature_type=’exon’, identifier=’gene_name’, sep=’t’ )
Purpose:
Perform transcripts per million sample normalization on RNAseq data
Formula:
\(TPM_{g} = \frac{1e6 \cdot r_{\textit{ge}}}{(\sum_{g=1}^{n} (\frac{1e3 \cdot r_{\textit{ge}}}{l_{\textit{ge}}})) \cdot \textit{l} _{\textit{ge}}}\)
Assumptions:
- Dataframe contains raw count data, where samples are along columns and genes across rows
- By default, this will take the longest transcript based on combined exon length. If you prefer to use the cumulative exon length of the Ensembl canonical transcript, you must first curate the GTF using
xpresspipe modifyGTF -g transcripts.gtf -l- If you performed isoform quantification and wish to length normalize each isoform, provide
identifier='transcript_id'- If you would like to normalize based on CDS length, provide
feature_type='CDS'Parameters:
data: Input dataframe with counts values
gtf: GTF reference file path and name
feature_type: Label of feature to use in length normalization
identifier: Label for how to group genes/transcripts. If normalizing for a gene, use
gene_name or gene_id. If performing length normalization for isoforms, provide transcript_idsep: GTF delimiter (usually tab-delimited)
Returns:
data_tpm: Pandas dataframe with TPM-normalized
Batch Normalize
xpressplot.batch_normalize ( input_file, batch_file )
Purpose:
Control for batch effects between datasets
Assumptions:
- Requires a properly formatted dataframe for xpressplot usage where samples are normalized previously if desired
- Requires a properly formatted dataframe complying to SVA COMBAT info file (see example below)
- R is installed on your machine and is in your $PATH
- All input files are tab-delimited (with .txt or .tsv suffix)
Parameters:
input_file: Input dataframe file with values (can be normalized or unnormalized)
batch_file: Input dataframe containing batch effect information, column naming convention must be followed and is case-sensitive
Examples:
> data = pd.read_csv('/path/to/expression.tsv', index_col=0)
> data
                s1_rpf  s1_rna  s2_rpf  s2_rna
ENSG00000227232 66.34   59.13   1.90    82.49
ENSG00000240361 35.73   0.00    7.38    72.94
ENSG00000238009 20.02   70.21   85.10   78.87
ENSG00000241860 96.23   7.49    93.49   38.39
ENSG00000187634 73.91   41.28   92.27   77.93
> batch = pd.read_csv('/path/to/batch_info.tsv', index_col=0)
> batch
  Sample  Batch
0 s1_rpf  batch1
1 s1_rna  batch2
2 s2_rpf  batch1
3 s2_rna  batch2
> xp.batch_normalize('/path/to/expression.tsv', '/path/to/batch_info.tsv')
Clean Data
xpressplot.clean_df ( data, axis=0 )
Purpose:
Cleans NULL values from axis and clears duplicate indices
Assumptions:
- Requires a properly formatted dataframe for xpressplot usage
Parameters:
data: Input dataframe file with values (can be normalized or unnormalized)
axis: Axis to clean NaN values from (default: 0, which corresponds to rows)
Returns:
data_clean: Cleaned pandas dataframe
Examples:
> data
                s1_rpf  s1_rna  s2_rpf  s2_rna
ENSG00000227232 66.34   59.13   1.90    NA
ENSG00000240361 35.73   0.00    7.38    72.94
Gene2           20.02   70.21   85.10   78.87
Gene2           96.23   7.49    93.49   38.39
ENSG00000187634 73.91   NA      92.27   77.93
> data = xp.clean_df(data)
> data
                s1_rpf  s1_rna  s2_rpf  s2_rna
ENSG00000240361 35.73   0.00    7.38    72.94
Set Gene Threshold
xpressplot.threshold ( data, minimum=None, maximum=None )
Purpose:
Cleans gene axis (assumed to by rows) of genes containing values below or above user-determined thresholds
Assumptions:
- Requires a properly formatted dataframe for xpressplot usage
Parameters:
data: Input dataframe file with values (can be normalized or unnormalized)
minimum: Minimum value all samples need of a given gene to avoid dropping across all samples
maximum: Maximum value all samples can have of a given gene to avoid dropping across all samples
Returns:
data_clean: Cleaned pandas dataframe
Examples:
> data
                s1_rpf  s1_rna  s2_rpf  s2_rna
ENSG00000227232 66.34   59.13   1.90    82.49
ENSG00000240361 35.73   0.00    7.38    72.94
ENSG00000238009 20.02   70.21   85.10   78.87
ENSG00000241860 96.23   7.49    93.49   38.39
ENSG00000187634 73.91   41.28   92.27   77.93
> data = xp.threshold(data, minimum=5)
> data
                s1_rpf  s1_rna  s2_rpf  s2_rna
ENSG00000238009 20.02   70.21   85.10   78.87
ENSG00000241860 96.23   7.49    93.49   38.39
ENSG00000187634 73.91   41.28   92.27   77.93
Prepare xpressplot Dataset
xpressplot.prep_data ( data, info, gene_scale=True, print_means=False )
Purpose:
Prepare dataframe for downstream analyses
Assumptions:
- Requires a properly formatted dataframe for xpressplot usage (genes as rows, samples as columns)
- Requires properly formatted xpressplot metadata dataframe
Parameters:
data: xpressplot formatted dataframe of expression values
info: xpressplot formatted sample info dataframe
gene_scale: Scale genes (rows) of data
print_means: Print means for each sample verification
Returns:
data_normalized: Normalized pandas dataframe
data_labeled: Labeled pandas dataframe
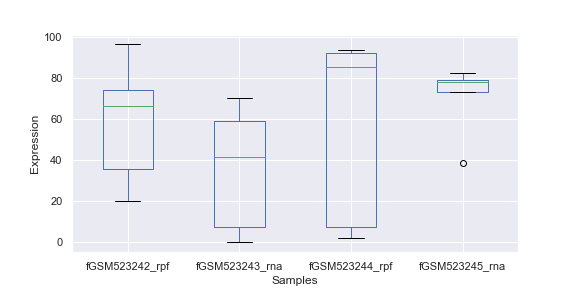
Check Sample Expression Distributions
xpressplot.check_samples ( data )
Purpose:
Visualize gene expression distributions on a sample-by-sample basis
Assumptions:
- Requires a properly formatted dataframe for xpressplot usage
Parameters:
data: Input dataframe file with values (can be normalized or unnormalized)
Returns:
Boxplot with samples on the x-axis and lump expression distributions for all genes in that sample
Examples:
> xp.check_samples(data)
Microarray Probe Collapse
xpressplot.probe_collapse ( data, reference, gene_list=None, no_multimappers=True )
Purpose:
Remove multimapping probes and collapse probes mapping to the same gene by averaging the values for those probes per sample
Assumptions:
- Requires a properly formatted dataframe for xpressplot usage
- Assumes GPL .txt file from NCBI is tab delimited
Parameters:
data: Input dataframe file with values (can be normalized or unnormalized)
Returns:
data_collapsed: Pandas dataframe file probes collapsed and the corresponding gene names listed
Examples:
> data
          fGSM523242  fGSM523243  fGSM523244  fGSM523245  fGSM523246
1007_s_at 66          59          1           82          45
1053_at   35          0           7           72          2
121_at    20          70          85          78          36
218024_at 96          7           93          38          85
240362_at 73          41          92          77          26
> probe_collapse = xp.probe_collapse(probe_test, '/path/to/gpl_ref.txt')
> probe_collapse
      fGSM523242  fGSM523243  fGSM523244  fGSM523245  fGSM523246
MPC1  84.5        24.0        92.5        57.5        55.5
PAX8  20.0        70.0        85.0        78.0        36.0
RFC2  35.0        0.0         7.0         72.0        2.0
> data
          fGSM523242  fGSM523243  fGSM523244  fGSM523245  fGSM523246
1007_s_at 66          59          1           82          45
1053_at   35          0           7           72          2
121_at    20          70          85          78          36
218024_at 96          7           93          38          85
240362_at 73          41          92          77          26
> probe_collapse = xp.probe_collapse(probe_test, '/path/to/gpl_ref.txt', no_multimappers=False))
> probe_collapse
                  fGSM523242  fGSM523243  fGSM523244  fGSM523245  fGSM523246
DDR1 /// MIR4640  66.0        59.0        1.0         82.0        45.0
MPC1              84.5        24.0        92.5        57.5        55.5
PAX8              20.0        70.0        85.0        78.0        36.0
RFC2              35.0        0.0         7.0         72.0        2.0